The Doctor’s Report turns your food diary into a clean, professional PDF you can hand to your nephrologist or dietitian. Instead of trying to remember what you ate over the past three months, your appointment starts with real data.
This feature requires KidneyPal Pro.
What the Report Is For
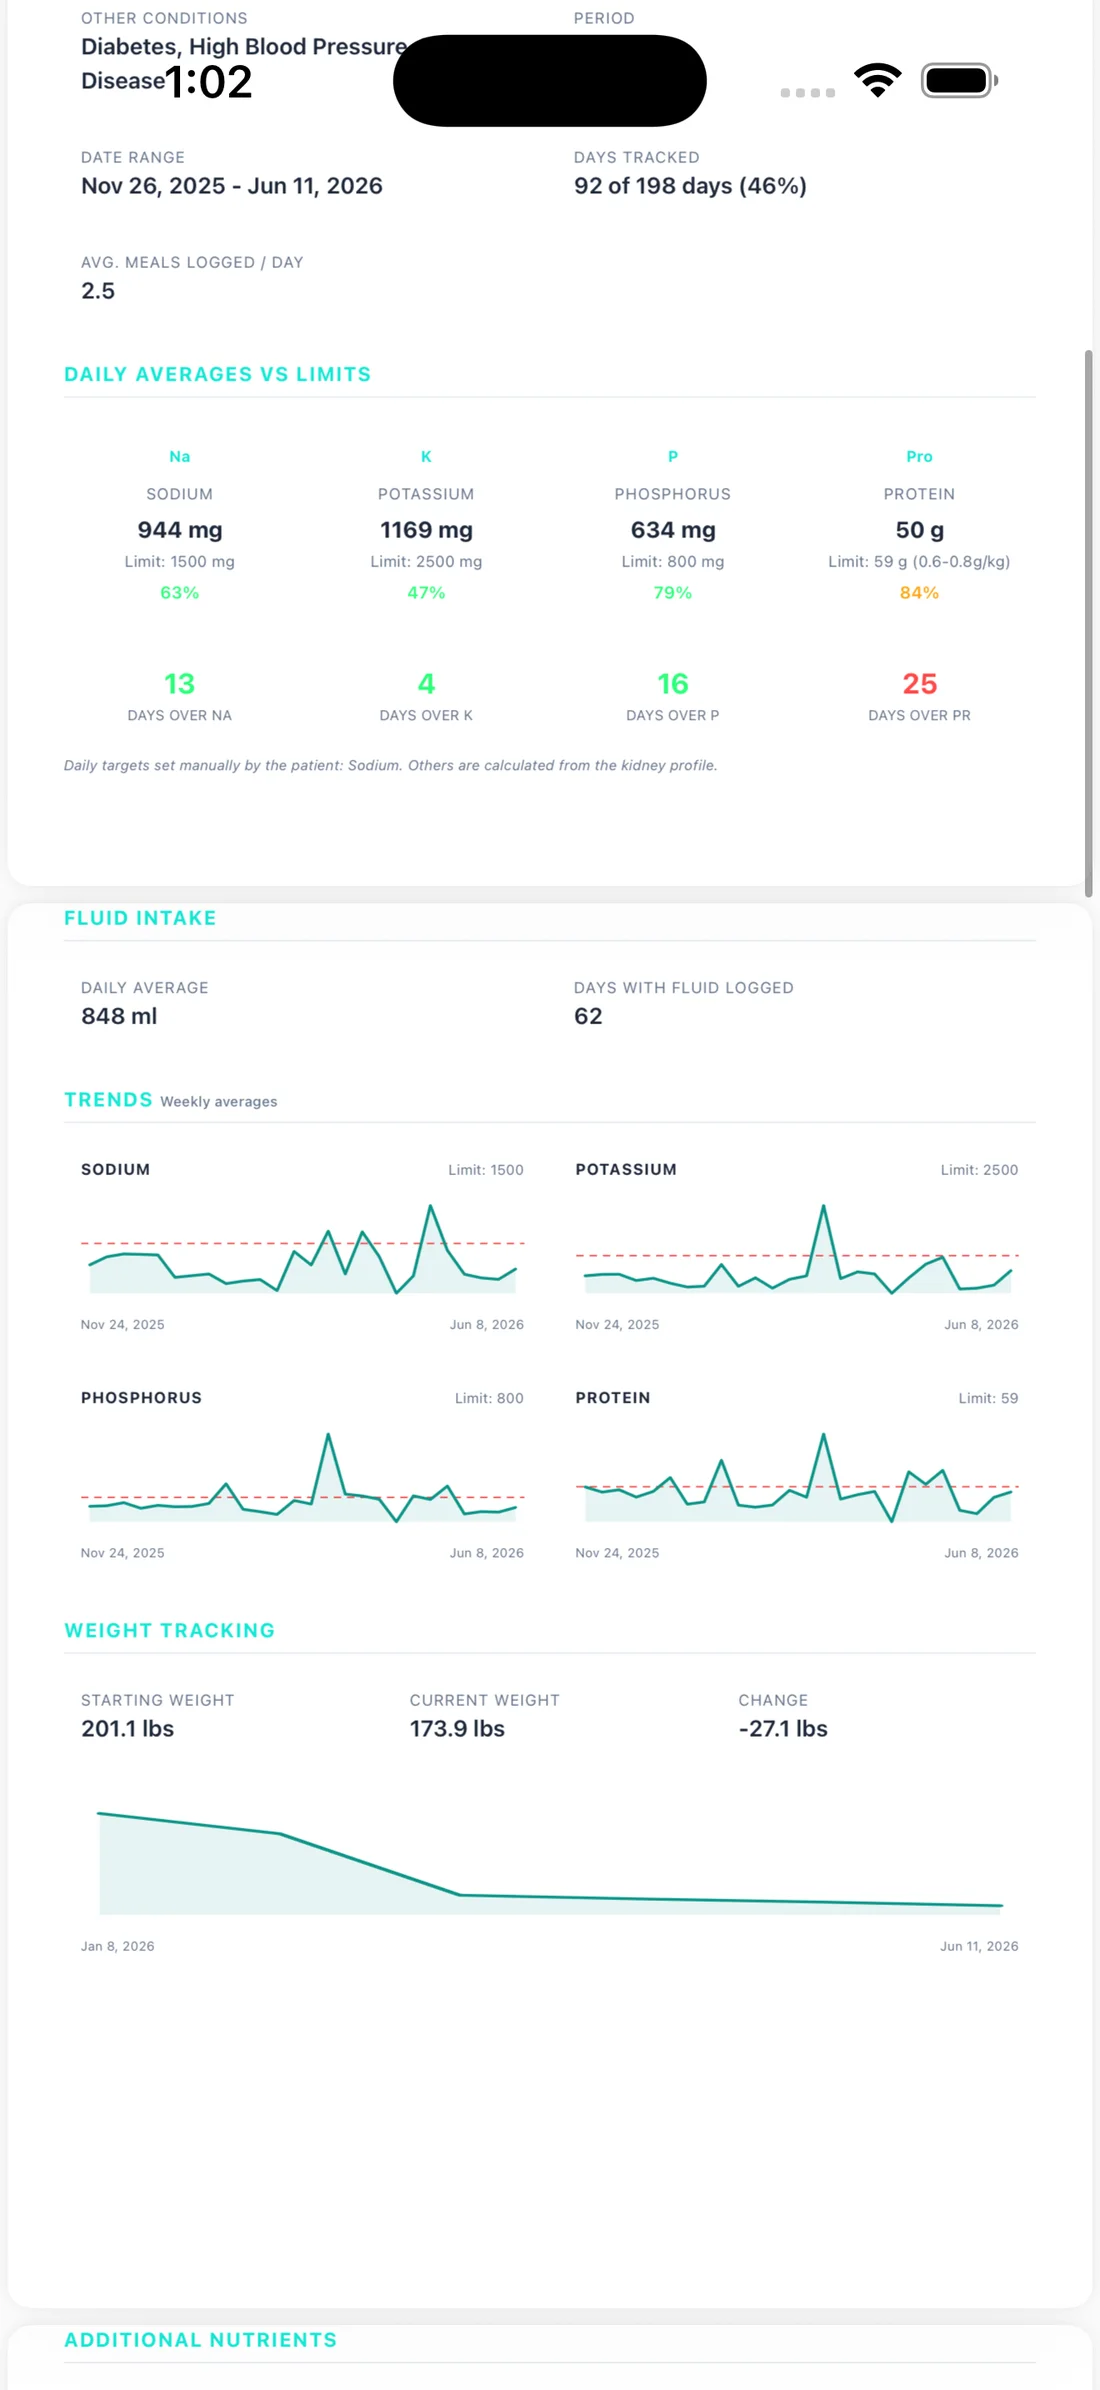
Most kidney appointments include some version of “So, how has your diet been?” — and most of us answer from fuzzy memory. The report answers with facts: your actual daily averages, exactly how often you went over each limit, and which foods show up most in your diet. It’s information for your care team to interpret, not a diagnosis — your doctor decides what it means for your treatment.
How to Generate a Report
- Open the Progress tab and scroll to the Doctor’s Report card.
- Tap Generate Report.
- In the Select Report Period dialog, choose one of:
- Last 30 days
- Last 90 days
- Last 6 months
- All data (covers up to the last two years of logs)
- Tap Generate Report to confirm.
After a moment, your device’s share sheet opens with the finished PDF. You need at least some logged days in the chosen period — if there’s nothing in that window, the report can’t be created.
Tip: If you’re not subscribed yet, the card shows a PRO badge and an Unlock button. See subscription options.
What’s Inside the PDF
Every report contains these sections, built entirely from what you’ve logged:
| Section | What it shows |
|---|---|
| Report Summary | Your name, the period, the exact date range, and how many days you tracked |
| Daily Averages vs Limits | Average sodium, potassium, phosphorus, and protein per day, each shown against your personal limit with a color-coded percentage |
| Days over limit | A count of days you exceeded each of the four limits across the period |
| Weight Tracking | Starting weight, current weight, and the change over the period — only appears if you logged weight in that window (see weight tracking) |
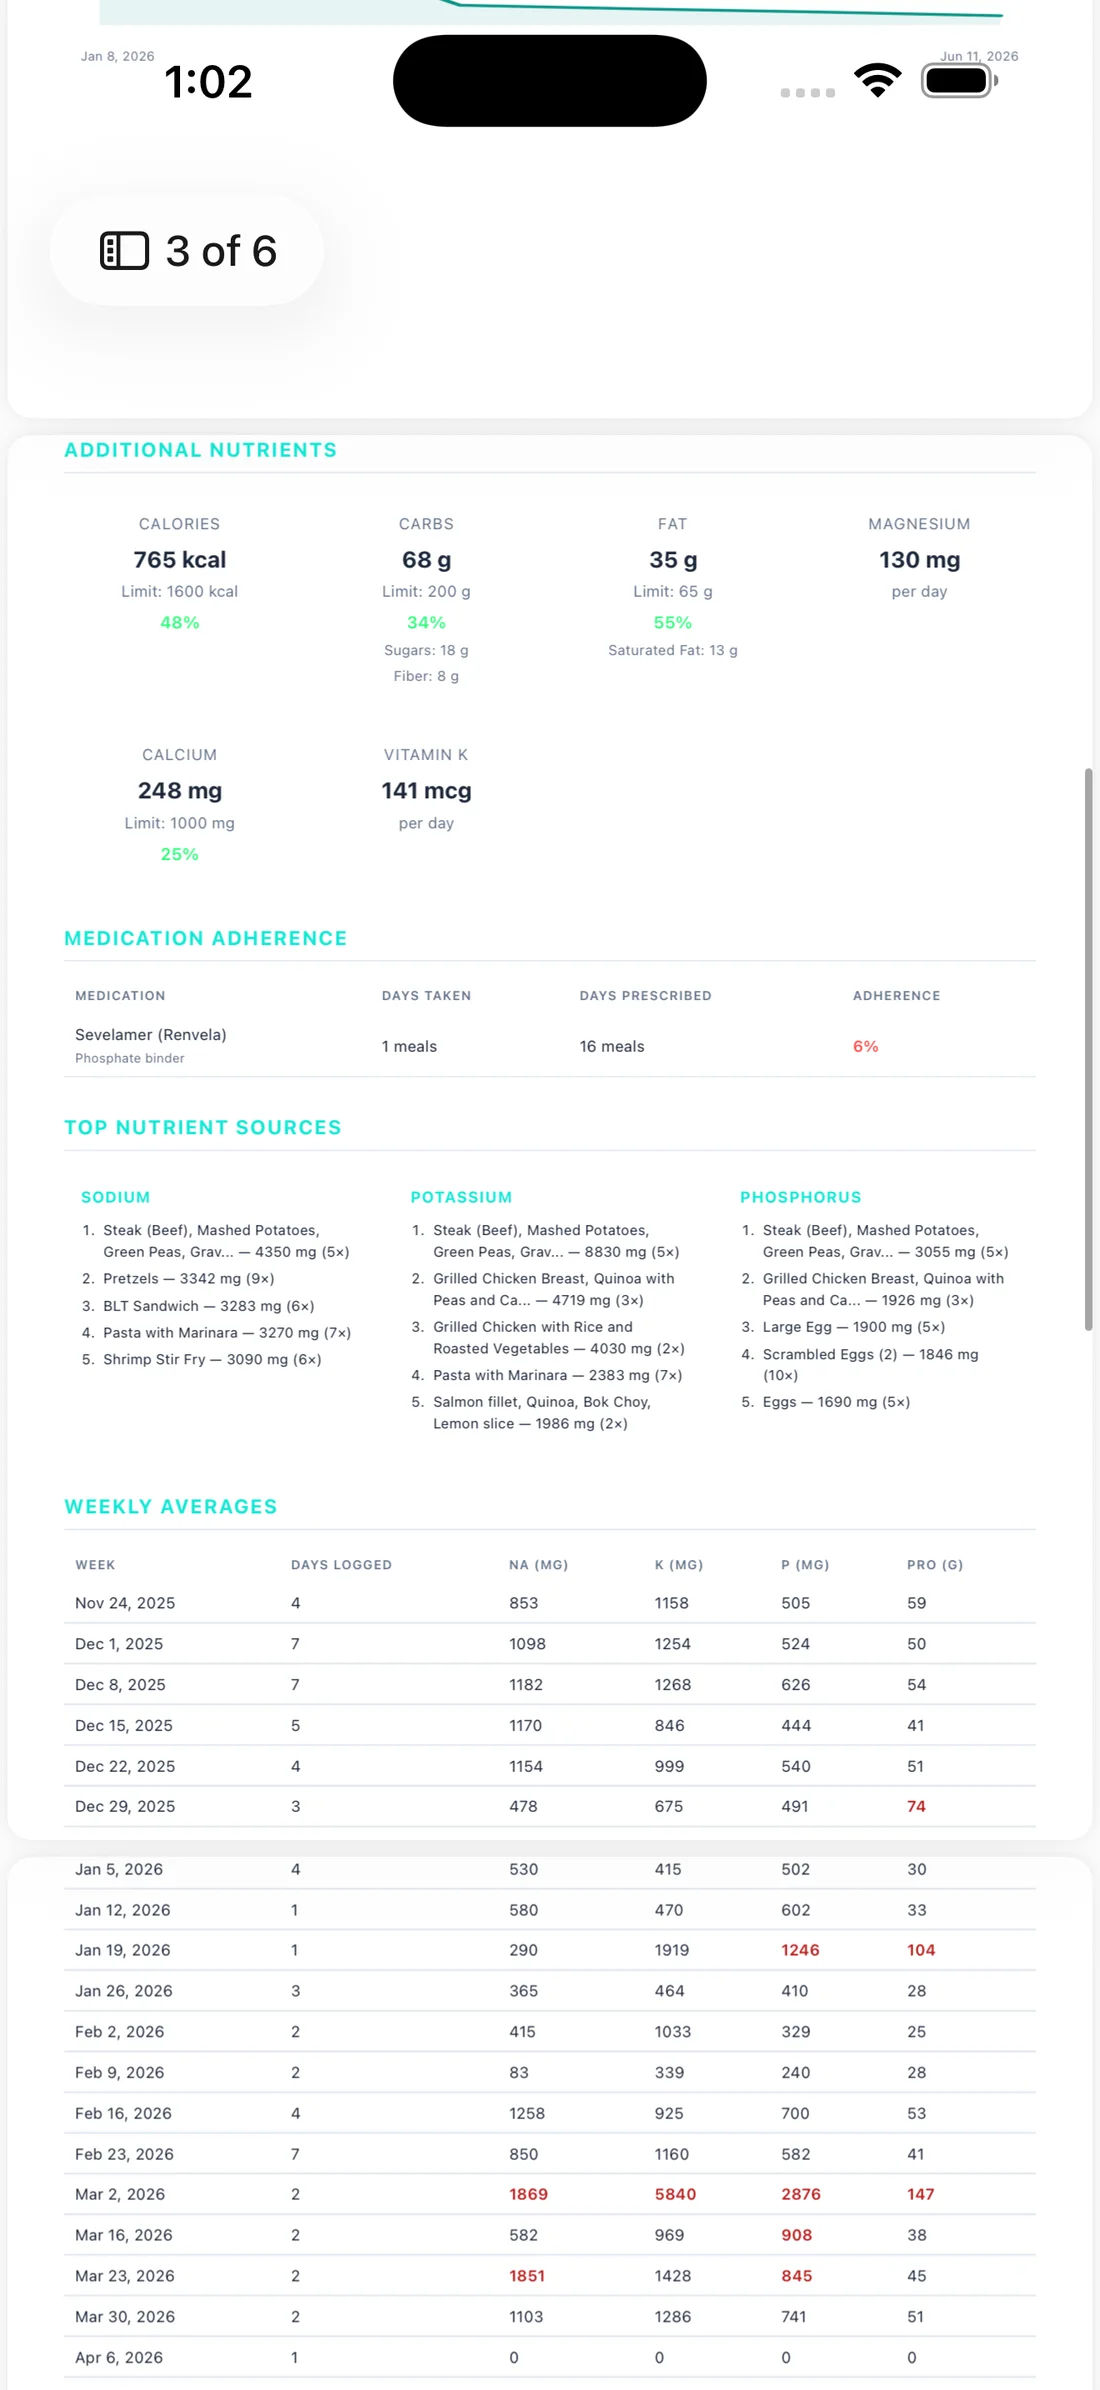
| Additional Nutrients | Daily averages for calories, carbs, fat, and magnesium, if you track optional nutrients |
| Medication Adherence | If you use the binder tracker: each binder with doses taken vs. prescribed and an adherence percentage. Phosphate binders are counted per meal; potassium binders per day |
| Daily Breakdown | A day-by-day table of your nutrient totals for the whole period |
| Most Frequent Foods | Your ten most-logged foods and how many times each appeared |
The report continues with your additional nutrients, medication adherence, the foods contributing most to each nutrient, and a week-by-week table:
The limits used in the report are your own — custom limits from your doctor if you’ve entered them, otherwise the ones calculated from your kidney profile. See how limits work.
The PDF is produced in whatever language you have the app set to.
Sharing and Printing
The report opens straight into your device’s share sheet, so you can:
- Email it to yourself or your clinic
- AirDrop it to another device
- Save it to Files or print it at home
Your doctor will love having actual data instead of you trying to remember what you ate.
Getting the Most Out of It
Tip: Generate a fresh report the day before each nephrology or dietitian appointment, and pick the period that matches the time since your last visit — Last 90 days if you’re seen quarterly, for example.
One honest note: the report reflects what you logged. If you tracked four days out of thirty, the averages describe those four days, not your whole month. The more consistently you log, the more useful the report becomes — the Days Tracked number on the summary tells your doctor exactly how complete the picture is.
Related
- Tracking your progress — the charts and insights behind the report
- Weight tracking — feed the weight section of your report
- Binder tracker — feed the medication adherence section