The Progress tab is your bird’s-eye view of how your kidney diet is going — not just one meal at a time, but across days, weeks, and months. A quick scroll tells you which days went well, where your trouble spots are, and what patterns are worth mentioning to your care team.
What’s on the Progress Tab
| Section | Free or Pro? |
|---|---|
| THIS WEEK summary | Free |
| NUTRIENT TRENDS charts | Requires KidneyPal Pro |
| Weight Trend chart | Requires KidneyPal Pro |
| SCAN HISTORY | Free |
| INSIGHTS (AI) | Requires KidneyPal Pro |
| Doctor’s Report | Requires KidneyPal Pro |
| MY NOTES | Free |
This Week Summary
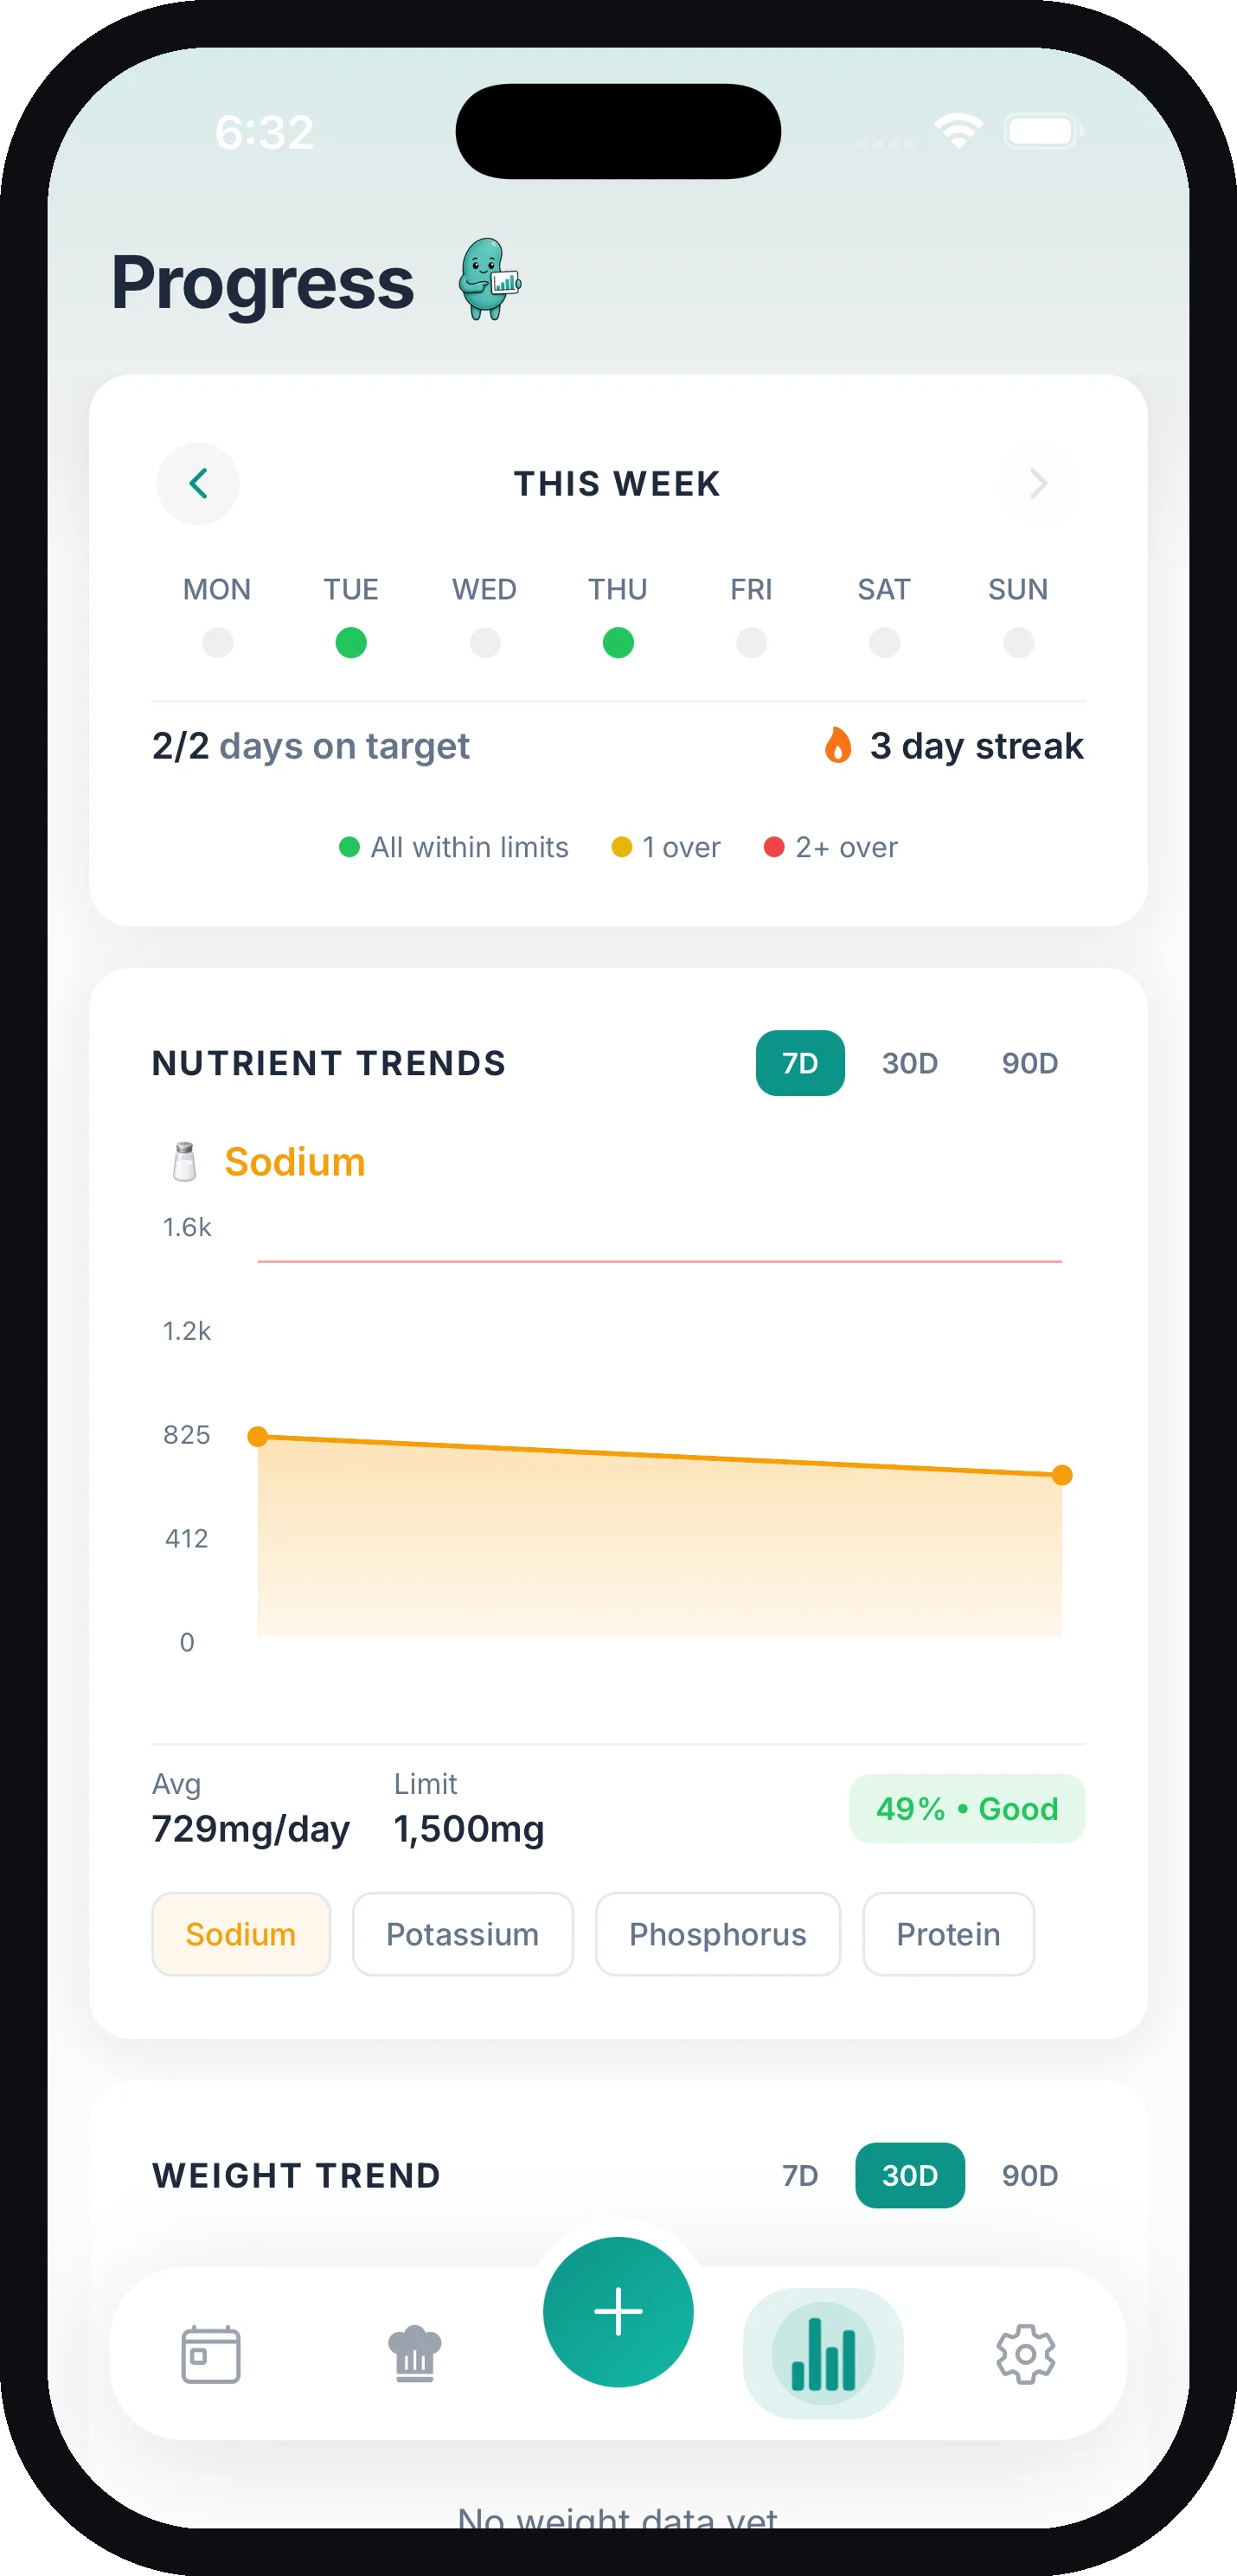
At the top of the tab, the THIS WEEK card shows seven dots — one for each day of the week, starting Monday. Each dot is colored based on how that day went against your four core limits (sodium, potassium, phosphorus, and protein):
| Dot color | Meaning |
|---|---|
| Green | All within limits — you stayed under all four |
| Yellow | 1 over — one nutrient went over its limit |
| Red | 2+ over — two or more nutrients went over |
| Gray | Nothing logged that day |
Your days on target count is simply the number of green days — days where everything you logged stayed within all four limits. The card also shows your current day streak.
Use the arrows on either side of the card to look back at previous weeks.
Tip: Your limits come from your kidney profile, or from custom limits your doctor gave you. See how nutrient limits work.
Nutrient Trends (Pro)
The NUTRIENT TRENDS chart requires KidneyPal Pro. Pick a nutrient — Sodium, Potassium, Phosphorus, or Protein — and a time window (7D, 30D, or 90D) to see a line chart of your daily intake.
Reading the chart is simple:
- The colored line is what you actually ate each day.
- A second flat line marks your daily limit — you want to stay below it.
- Days where you logged nothing are skipped, so the chart only reflects real data.
Below the chart you’ll see your Avg (average intake per day for that period) next to your Limit, so you can tell at a glance whether you’re running high or comfortably under. This is great for spotting patterns like “I always go over on sodium on weekends.”
Your Streak
Your streak counts how many days in a row you’ve logged something — a meal, a snack, or even a glass of water all count. Log at least once each day and the streak keeps growing. Miss a whole day and it resets, but your longest streak is saved separately as your Best, so your record lives on.
You’ll get a little celebration when you hit a milestone:
| Days | Milestone |
|---|---|
| 3 | 3-Day Streak! |
| 7 | 1 Week Streak! |
| 14 | 2 Week Streak! |
| 30 | 30-Day Champion! |
| 60 | 60-Day Streak! |
| 100 | 100-Day Master! |
Tip: If it’s 8:30 PM and you haven’t logged anything yet, KidneyPal can send you a gentle reminder so your streak survives the day. Turn it on in notification settings.
AI Insights (Pro)
The INSIGHTS card requires KidneyPal Pro. It looks at your last 30 days of diary entries and surfaces up to four personalized observations — warnings in orange, wins in green, and tips in blue. Things like:
- Sodium Over Limit — how many days you went over, plus your top sodium sources by name
- Great Sodium Control or Potassium in Check — when you’ve stayed comfortably under for most days
- Phosphorus Watch and Protein Intake High — nutrients trending over your limits
- Low Protein Intake — if you’re averaging well below your protein target
- Excellent Compliance — when you’ve met all your limits on at least 80% of tracked days
- Keep Tracking or Consistent Tracking — nudges and kudos about your logging habit
Insights recalculate every time you open the Progress tab, and you can tap the refresh icon on the card to update them on demand. They need a little data to be meaningful — after about a week of logging, the patterns start to get genuinely useful.
Scan History
The SCAN HISTORY card shows thumbnails of your recent meal scans, each with its safety grade. Tap any thumbnail to reopen the full analysis, or tap View All to open the complete grid of every scan you’ve made.
On the Scan History screen you can also clean house:
- Long-press any scan to start selecting.
- Tap more scans to add them, or use Select All.
- Tap the red delete button at the bottom (it reads Delete 3 Scans, with your count) and confirm.
Deleting scans is permanent — it removes the photo and analysis — but it doesn’t change what’s logged in your diary, so your nutrient history stays intact.
My Notes
The MY NOTES card collects every daily note you’ve written, newest first. Tap View All to see the full My Notes timeline, with each note under its date.
Notes are a nice companion to your charts: jot down how you felt, swelling, energy, or anything your doctor asked you to watch, and review it side by side with your nutrient data. You add notes from your diary.
What’s Next
When you’re ready to turn all this tracking into something you can hand to your nephrologist, generate a Doctor’s Report. And if you’re tracking weight too, see weight tracking.